 General information to the microanalysis
EPMA
Info1
Info2
Info3
Info4
Info5
Info6
Info7
Info8
Micro-XRF
Info1

Basics of the x-ray excitation by electrons
In the energy region of the primary electrons from 5 to 50 keV the following interaction
processes between electrons and target (specimen) are important, from the view of Electron Probe
Microanalysis (EPMA):
A
elastic interaction effects of the electrons
-> backscattering electrons
-> expansion of the focused electron beam
B
stopping radiation of charged particles in the electrical Coloumb field of nucleous
-> Bremsstrahlung (x-rays with continuous spectrum)
C
ionization by pulling out electrons from the internal levels of the electron shell of atoms
- > characteristic x-rays (discrete characteristic energies)
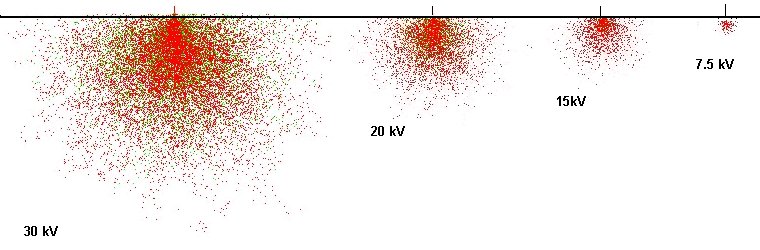
The three interaciton effect processes lead to the model of the "ionization pear" in the EPMA:
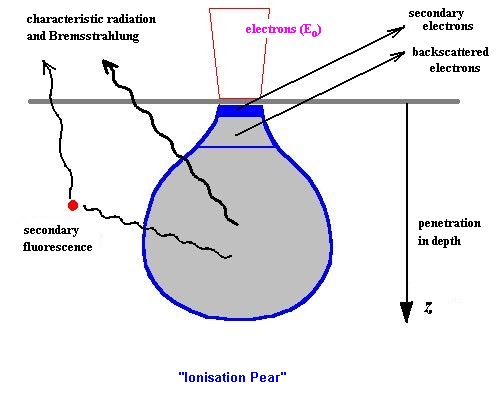 Pattern of the "ionization pear"
The characteristic radiation results from suggestions in the atomic shell. An electron is pulling
out from an internal level. A so-called vacancy develops. Since the excited atomic shell aims at
the equilibrium of the smallest internal energy due to generally accepted principles, this vacancy
fills up itself by an electron of a higher energy level. According to the potential model exists a
difference between both energy levels of the electron shell. This energy difference is lost, but in
form of a radiation quantum is delivered.
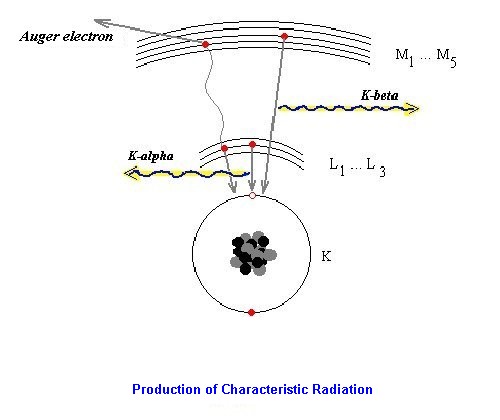
There exists a competitive process, the delivery of the energy difference via emitting an Auger electron.
The energy of a x-ray line (energetic position of the line in the spectrum) is the indicator for it,
which element it concerns (Mosely's law). The ' strength ' of the line depends on the concentration of the element within the sample.
Excitation:
The middle penetration depth of the electrons Zm and with this the lateral resolution of the
EPMA can be calculated from the middle loss of energy of the electrons within the sample:
Zm = 0.033 ( Eo2 - Ec2) / dens
(Eo und Ec in keV; dens in g/cm3)
Eo ...primary electron energy
Ec ...energy of the excited electron shell
dens ... density of the sample
Example:
Detection of Fe (iron, Ec = 7,12 keV) in a sample with dens = 8 g/cm3:
Eo
15 keV
20 keV
30 keV
Zm
0.7 um
1.5 um
3.5 um
For real samples and excitation conditions values in the order of magnitude of microns result.
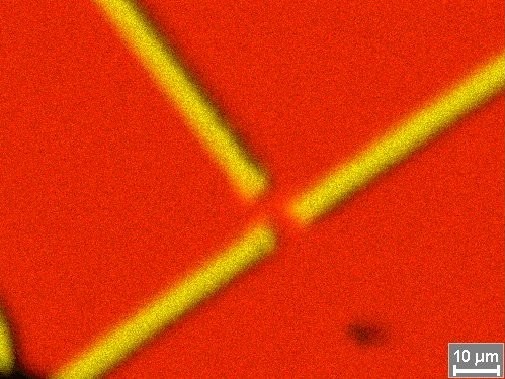
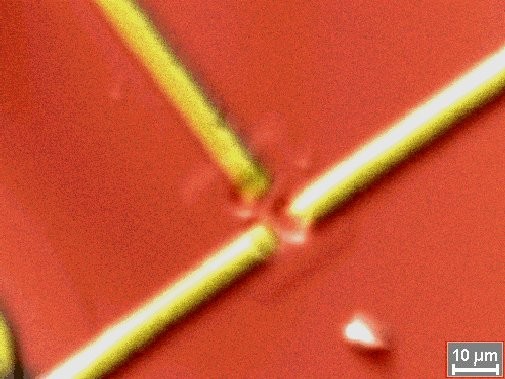
Element picture (map) of a chip structure at the border of resolution of x-rays with 15 kV high
voltage -
right picture with electron image overlays (red = Si / yellow = Al)
The optimum for the ionization of the regarded shell (thus the characteristic x-ray) is attached:
Uo = Eo / Ec = 3
Thereby an optimal excitation of all lines of the examined sample is never given, there a
spectrum of all x-ray quanta with only unique primary electron energy (high voltage of Scanning
Electron Microscope - SEM) is measured. The ionization cross-section has its maximum with a
"overvoltage" Uo (quotient from primary electron energy Eo and critical excitation energy of
the regarded shell Ec) with approximately 3 and falls at larger values however again only slowly.
At smaller values, thus if the energy of the electron comes into the region of the critical energy,
the ionisation cross-section drops rapidly.
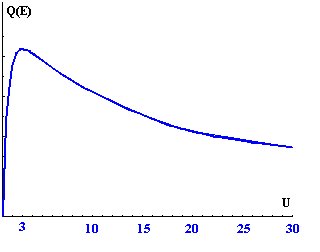 Plot of the ionization cross-section over U
That is a substantial difference to the ionization by x-ray quanta (- > x-ray fluorescence), since
there exists the suggestion by x-ray 'resonance' with the electron shell and because of that a
maximum of the ionization cross-section exactly. A too large overvoltage is less critical thereby
than a too small.
With the primary electron energy and the choice, which line series of an element is to be
analyzed, also a different surface sensitivity and a lateral resolution of the EDX analysis are
selected:
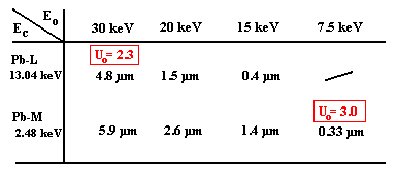
 green: Pb-L / red: Pb-M
The analyst always stands before the problem of the optimization of the analysis conditions. A
larger accelerating voltage improves the excitation, increased however the penetration depth of
the electrons and with this the absorption of the x-ray quanta produced in the sample, too. The
excitation should be so large that for all elements in the sample a overvoltage Uo of at least 2
exists.
Due to the absorption effects, which can make a quantitative evaluation more difficult of the
spectra substantially, the choice of primary electron energy should be anough but not higher than
necessary. Naturally also lateral resolution and resolution in depth worsen with a higher primary
electron energy.
Absorption:
In the sample in a depth of typically a micrometer produced x-ray quanta have to penetrate the
specimen layers above to fly finally to the x-ray detector (energy dispersive x-ray detector, EDX).
In this way it is weakened within the sample (self absorption) and within the x-ray entrance
windows of the detector (absorption of x-rays -> efficiency of the x-ray detector).
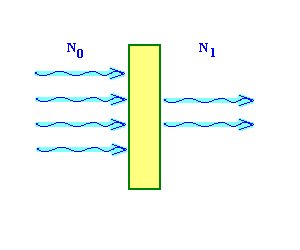
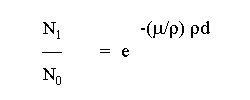
The absorption of x-ray is described with the exponential mass attenuation (or mass absorption)
law and depends on the energy of the x-ray quanta and the kind and thickness of the material
which can be penetrated:
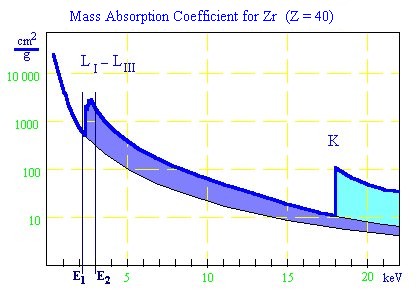 Mass absorption coefficient for Zr
The mass absorption coefficient is a complicated function of the atomic number of the absorption
layer and the energy of the x-ray. Every time the energy of the radiation can excite a further shell
of the atoms of the attenuation layer, a jump of the function (absorption edges) takes place.
Further information for self-absorption in the sample:
Info4

Bremsstrahlung, the background in the EPMA:
Every time charged particles are accelerated or braked, they produce electromagnetic radiation.
This principle is used in an antenna, in which electrons are back and forth moved. With the radio
or the TV home receiver this electromagnetic radiation will receive.
Since the electrons in the scanning electron microscope have however a very high speed (a 10
keV electron has a speed of approx. 20% of the speed of light!), with the deflection and/or
braking of the electrons in the electrical field of the atomic nuclei in the examined sample an
electromagnetic radiation in the x-ray energy region is emitted.
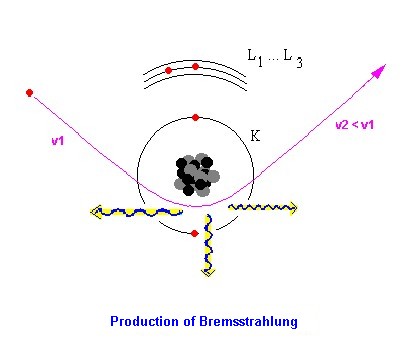
Since all possible deflections and decelerations can take place in the electrical fields of the
atomic nuclei, a continuous energetic spectrum of x-ray quanta (the Bremsstrahlung) develops .
The maximally possible energy develops if an electron, which was not affected yet and so that
still have the entire primary electron energy, completely is braked. The continuous
Bremsstrahlung spectrum ends exactly with the primary electron energy Eo.
The measured spectra in energy dispersive EPMA consists thus of two basic components, the "peaks" of the characteristic radiation and the Bremsstrahlung background:
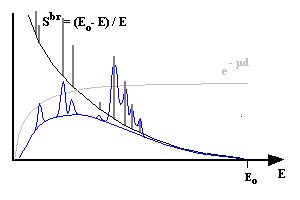 Overlay: char. Radiation, Bremsstrahlung and absorption
Detection limits (EPMA):
Since for the detection limit of an element then the measuring signal/background (signal / noise)
relationship is substantial, the Bremsstrahlung is responsible for the fact that the relative
detection limit cmin with approximately 0,1 % mass fraction of an element. In the comparison
to trace element analytics it is very modestly.
In connection with the local resolution of the electron microscope it results however that the
analyzed substance volume is in the order of magnitude from typically a cube micron. Thus the
absolutely detectable substance quantities of mmin of the energy dispersive EPMA are in the order of magnitude
of 0.1 pg (see diagram) and almost unbeatable by other methods of instrumental analytics:
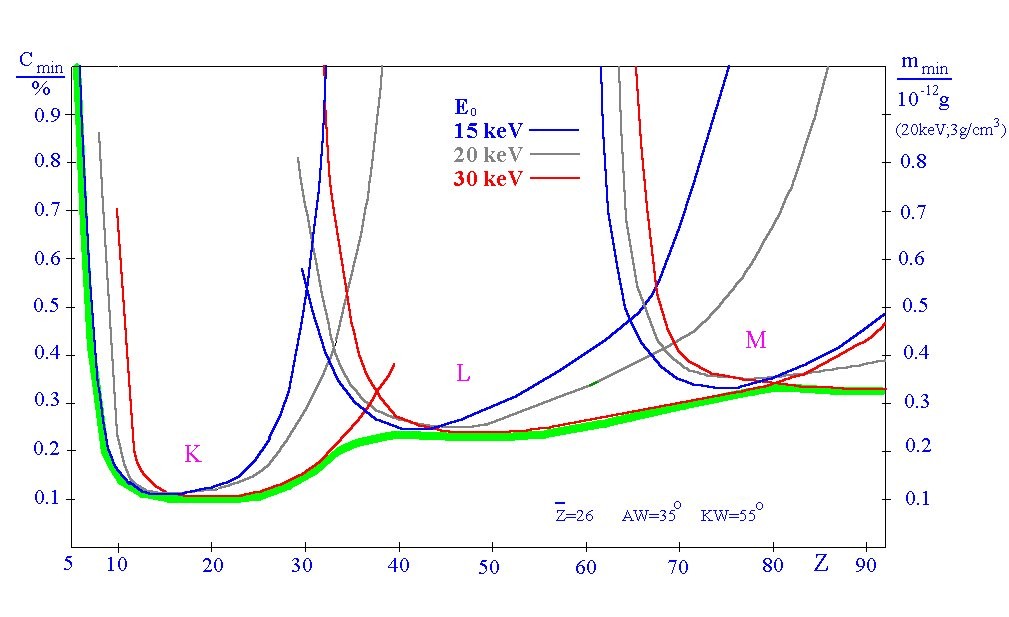
Detection limits of the energy dispersive EPMA with an EDX spectrometer
(
full image
)
The detection limits depend slightly on the middle atomic number of the examined sample
volume and the excitation conditions (selected high voltage SEM). The delimitation of the
detection limits on approx. 0,1% arises as a result of the always parallel produced bremsstrahlung
background and is method dependent.
Only if the resolution of energy (semiconductor detectors with typically 140 eV) can be improved around an order of magnitude, also the detection limits are reduced to approx. 0,01%
(WDX spectrometer, micro calorimeter)