 Common Information to Microanalysis
EPMA Info1
Info2
Info3
Info4
Info5
Info6
Info7
Info8
Micro-XRF
Info1

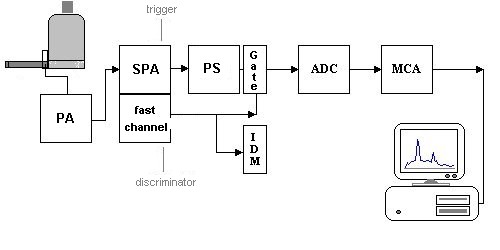
The Energy Dispersive System (X-Ray Spectrometer) EDS / EDX
A basic knowledge of the principles of an EDX is useful for interpretation and evaluation of energy dispersive spectra.
The energy dispersive system for photon detection has in general a silicon semiconductor detector with a high impedance zone which is radiation-sensitive. Both, the detector and the field-effect transistor of the first stage of preamplifier are cooled to get an optimum of energy-resolution.
Inside the detector, each absorbed X-ray quantum is converted into a cloud which consist of pairs of charge- carriers (electrons) and holes. A strict proportionality of the number of the charge carriers to the photon energy is given. Due to a high voltage, which is between both ends of the sensitive area of the detector, the charge carriers are moved and collected at the ends of the sensitive zone. With a charge-sensitive preamplifier (PA) the charge quantity is finally converted into a voltage-pulse. With a detector-capacity of approx. 2 pF, a X-ray quantum of 1 keV energy produces a voltage-pulse of approximately 20 microvolt (!). The pulse is amplified and shaped in a spectroscopic amplifier (SPA). Thus the signal-to-noise ratio is increased. With an analog-digital converter (ADC) each pulse is measured individually. Then the current channel contents of an pulse-height spectrum will be incremented at concerned channel (with knowledge of the ADC-data word). Before the ADC is able to measure the value, the maximum of the intensified pulse must be detected or stretched for measurement (peak-detector or peak-stretcher PS). If the ADC is fast enough, the point of the maximum signal is determined only for analog-digital conversion (the PS is not needed).
Modern systems begin in the digitization of the signals already before. Here the preamplifier-signal is already digitized in the intensified condition and improved then by multiple scanning of the pulse amplitude the signal-to-noise ratio digitally (averaging).
In the spectroscopic channel the pulses are filtered with a long as possible shaping time. The noise is suppressed to reach a very good energy resolution. However X-ray quanta are not differentiated, if they arrive briefly one behind the other (in the shaping time).
Additional mechanisms in the pulse-processing unit (the fast channel) permit the recognition and excluding those pulses, which arrive with a short delay time and are not visible in the spectroscopic amplifier due to bad time-resolution. Finally a wrong pulse is avoided with a pulse-height composed of both pulses. In the 'fast channel' also the pulse- density is determined (IDM).
The time separation (resolution) is substantially better in the fast channel due to shorter pulse-shaping times (-> processing time for each X-ray quantum). But the energy-resolution is worse. The signals, which arrive briefly one behind the other and cannot be differentiated by the spectroscopic amplifier, are recognized by the 'fast channel'. And then these pulses will be rejected over a gate (Pile-up discrimination). An additional dead time is produced, which rises with pulse density.
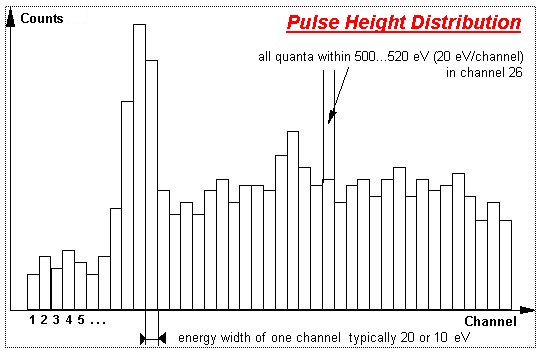
In the ADC and MCA (multi-channel analyser) the pulses are digitized and stored as pulse height spectrum. The energy region which can be measured is divided into channels (typical number of 1024 or 2048). The energy width of a channel depends on the amplification gain and amounts to typically 20 or 10 eV/chnnel. From both values results the entire mesured energy region of the spectrum.
Each individual X-ray quantum is measured in the energy and sorted into the corresponding channel. That happens, as the number of the quanta (pulses) is always increased in the appropriate channel by 1. Thus a pulse amplitude spectrum develops, in which the stochastically measured discrete X-ray quanta are sorted according to the energy and are collected for different energy types. The X-ray spectrum of the EDX is thereby a histogram (energy distribution of all collected X-ray quanta). The spectrum grows at the same time in all channels.
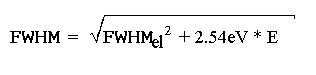
Due to the statistic processes in the detector and in the field-effect transistor it comes to a widening of the natural line width. The full width at half maximum (FWHM) depends on the energy of the X-ray quanta E and corresponds to the following relationship:
FWHMel is the electronic width, which is essentially determined by field-effect transistor, detector capacity, detector currents and pulse-shaping. The second part of the relationship (the detector portion) is computed for an ideal detector from Silicon material with a FANO-factor of approximately 0.12. All values are to be used in eV.
Example: electronic noise 63 eV:
E
FWHM
resolving power
0.5 keV
72 eV
14 %
1.0 keV
81 eV
8 %
5.9 keV
138 eV
2.3 %
10 keV
171 eV
1.7 %
20 keV
234 eV
1.2 %
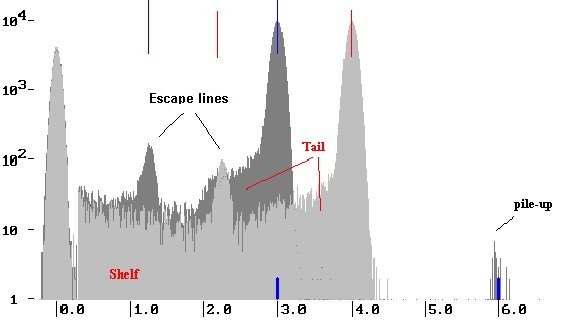
Spectra artefacts:
The energy dispersive measured spectra for monoenergetic radiation of 3.0 keV and to 4,0 keV (at Synchrotron, double crystal monochromator) are logarithmically represented in the illustration. Beside the main line one can find in each case an additional line in the spectrum at a distance of approximately 1,75 keV (within the low-energy spectrum range). These escape pulses result from charge-carrier collection-losses in the detector, exactly if an excited Si K-radiation quantum leaves out the detector during the ionization processes (via front window).
Additional pulses are registered with double line energy. The height of these so-called 'pile-up' pulses depends from pulse density. The pile-up develops, if two or more X-ray quanta are registered within a so short time interval in the detector, that also the fast channel of signal processing unit cannot differentiate between them any longer.
A small temporal disalignment of the X-ray quanta is detected and rejected. If the pile-up rejection process does not work, dependent on the temporal disalignment the first signal is then falsified more or less by the second signal in the spectroscopic amplifier in pulse-height. Then there are false pulses even between the energy of the radiation and the double-energy pile-up peak (continuous pile-up).
On the low-energy side of the full energy line a continuous underground component (Shelf) is present, which develops mainly due to diffusion of charge carrier from the inactive layers of the detector into the active volume.
An energy dispersive measured X-ray peak can be described in first approximation with a Gaussian form (due to the statistic causes of the line-broadening). Other incomplete charge carrier collecting-effects provide for additional energy-dependent asymmetry components (Tail). All these processes together can be described with the term ICC (incomplete charge collection).
Characteristics with spectrometry below 1 keV
Shifts of peak positions toward smaller energies are possible with energies of less than 300 eV. Here the energy dispersiv detector (EDX) becomes non-linear.
Ultra thin windows and already detectors with very thin beryllium window have a possibility for transmission of electrons with higher energies. An electron trap to protect the detector from high-energy scattered electrons from specimen inside the electron microscope is necessary. The electron traps are equipped with permanent magnets, which divert the electrons from their course. The electron trap works only up to a certain primary electron energy (typical to Eo = 30 keV).
Note:
If the detector is not coaxially aligned to the point of X-ray emission and main electron source (electron focus in Electron Microscope), the electron trap can 'suck in' the specimen-scattered electrons. This is also with wrong work distance from specimen surface to pole piece (wrong 'EDX working distance'), if the electron trap is wrongly mounted at he EDX-detector (The direction of the magnetic field is responsible and important!).
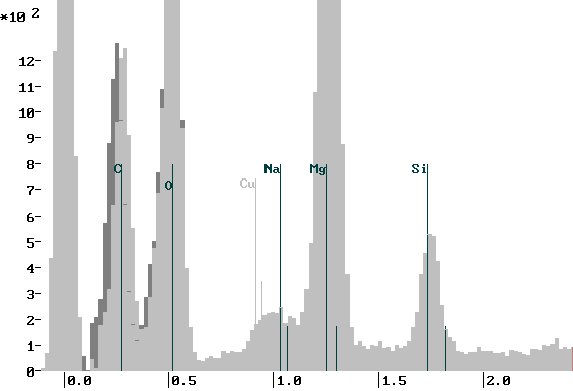
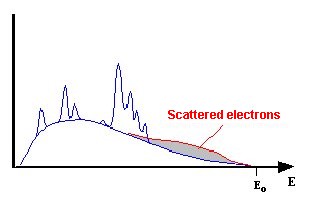
Backscattering electrons become apparent in the spectrum, if the bremsstrahlung background within the high-energy range gets a not typically shape with turning points (heavy case), or simply, if the computed bremsstrahlung do not fit at the end of the spectrum. The analysis becomes incorrect for those elements, whose characteristic lines are affected by the electron continuum (essentially if P/B method is used!).
Attention!
The fast channel has a worse resolution of energy and thus a higher self-noise due to the short pulse shaping. The discriminator threshold can be down-turned thereby not as far as the trigger threshold. This threshold stands typically somewhere between 500 and 1000 eV. That leads to the fact that
- the pile-up rejection does not work for low energies (light elements) in principle...
- the light elements do not contribute to the indicated impulse density...
If the spectrum is dominated by X-rays below 1 keV or with very long acquisition times, the continuous pile-up effects with low energy radiation always becomes visible more and more. A pulse density of possible 1000 cps (counts per second) and less is to be adjusted during spectra acquisition (recommended less than 500 cps), in order to avoid these distortion effects (to avoid misinterpretation of alleged lines, which represent pile-up effects in reality)..
Irony of the fate is, that now the pulse densitometer IDM indicates also a wrong (much too low) pulse density in case of many low-energy photons. The microanalyst is in mind to measure with low pulse density. In reality you have however substantially higher values, which can cause spectrum distortion. The true pulse density can be determined after the end of the data acquisition by summation of all pulses in the spectrum and division through the acquisition time (with consideration of pulse processor dead-time the input count rate is possible to calculate, which is what we want to know). Please check this with your EDX-spectrometer (e.g. BN-specimen)!
These working principles are also responsible for the limits of mappings with high count-rates, performed with EDX-spectrmeters, which have no Beryllium-window. The element distribution for light elements is strongly influenced with pile-up effects (even with noise counts), not usable in common case. Otherwise all pile-up counts of low energy quanta (light elements and L- and M-lines of higher atomic number elements) together with all other lines of the heavier elements affect the entire spectrum. An EDX with Beryllium-window at the front end (for absorption of soft X-rays) is the only usable choice to perform high count-rate mapping or element-imaging.
Further information for the examination of the EDX:
Info6