 Common Information to Microanalysis
EPMA Info1
Info2
Info3
Info4
Info5
Info6
Info7
Info8
Micro-XRF
Info1

The Self Absorption
Rough Surfaces / Soft X-Rays
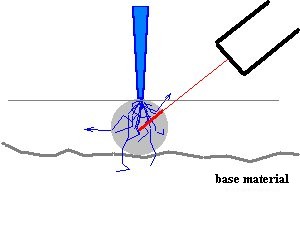
The dominating effect during the quantitative evaluation of the EPMA spectra (EDX analysis) is absorption of the produced X-ray in the sample (self-absorption). With undefined surfaces (unpolished samples, inclusions, broken parts, particles...) the absorption way of X-rays is unknown within the sample. But with the absorption way the count rate of X-rays can change substantially. These effects depend nonlinearly on the energy of the regarded radiation and on the elements existing in the sample. ( Info1  )
)
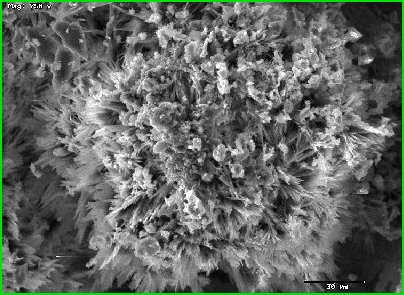 Each visible particle of crystallization with sizes of few micrometers is possible to excite for emission of X-rays.
With very soft X-rays (energy < 1 keV) the penetration ability of X-rays becomes so small that the absorption effects everything outweigh. Even neighbouring elements with similar energy can show a completely different absorption behavior, dependent on all other elements existing in the sample.
Rough Surfaces
With undefined surfaces the absorption way is generally unknown and different from the absorption of an flat polished sample of same composition. The absorption is usually substantially higher in a valley. In peaks and in particles on a substrate the absorption is usually smaller.
Note!
It is not possible to scan over wide area of surface to adjust the influence of rough surface and to make the spectrum not influenced of different absorption. Due to the nonlinear relations the resulting spectrum is not result of an arithmetic means of the different absorption ways. Ranges with strong absorption affect themselves more strongly and do not become balanced not by a number equal in size of ranges with small absorption! A scan with smaller electron microscope magnification over a rough surface supplies a spectrum with typically higher absorption in comparison to a spectrum of a sample of same composition, but flat and polished. With very strong roughness (e.g. broken specimen) the resulting absorption can be smaller.
How do differences in the surface orientation (thus in the absorption way) affect the spectrum? A model test is to clarify this:
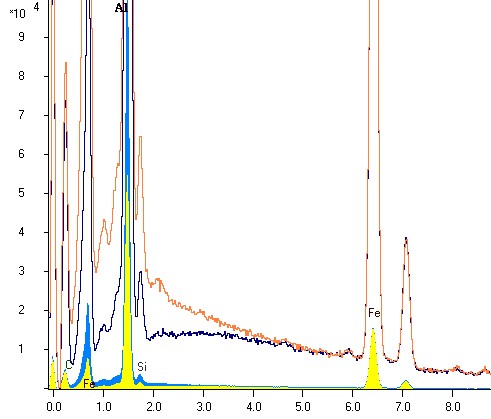
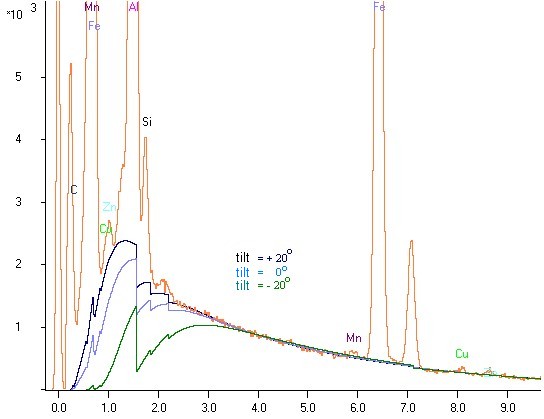
An polished sample with an element in the low energy region (aluminium, 1,5 keV) is tilted once to the detector and once away from the detector, in each case around 20o. For each case a spectrum with same excitation conditions is acquired. Both spectra of the same sample are laid on each other in the following picture to compare:
It is to be recognized clearly that the aluminum peak height differs around the factor 2 despite identical sample
(see the comparison with low vertical stretching, the yellow and blue bar- spectrum)!
How is shown in the illustration, substantial deviations in the EDX analysis spectrum (characteristic radiation and bremsstrahlung) are observed in the lower energy region. The net counts (without underground) of aluminum peak in the spectrum with large absorption (tilting the sample away from the detector) is about half of the height of the aluminum peak in the spectrum with small absorption (tilting to the detector). One can learn two things from this attempt, which is repeatable immediately at each EDX / EPMA- system:
1. A quantitative evaluation without consideration of different absorption conditions would result up to the double
value of the concentration in the case of small absorption compared with the result in the case of high
concentration (100% error, no actual a quantitative result).
2. For the increase of counts in the lower energy region (decrease of the error of the result of analysis),
a minimization of the absorption always is of advantage by a tilting of the sample to the detector!
Local inclinations of 20o are relatively small compared with a rough surface. The model-test shows, a quantitative analysis is impossible even with these small inclinations, if determination and consideration of absorption conditions is not taken into account.
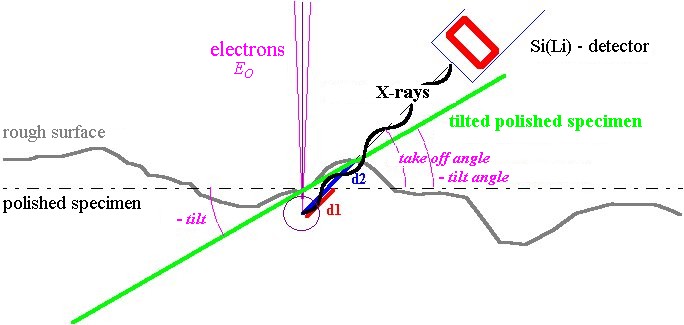
A possible solution is demonstrated in the following illustration:
The characteristic x-ray and the bremsstrahlung have both nearly the same absorption way. It should be obvious to determine the actual absorption conditions from the energetic distribution of the bremsstrahlung continuum. It is possible to use the resulted knowledge for the computation of the concentrations, for which the characteristic radiation is evaluated.
Soft X-Rays
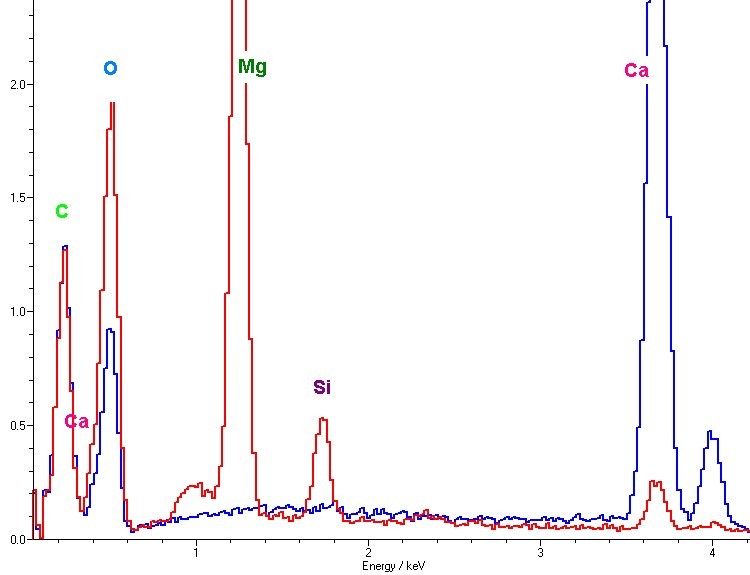
In the following illustration two spectra are compared. The first spectrum is of a CaCO3 sample, the other one from MgCO3 with same excitation conditions. In both samples carbon and oxygen are in the same atomic relationship. The ratios of peak heights are however extremely different:
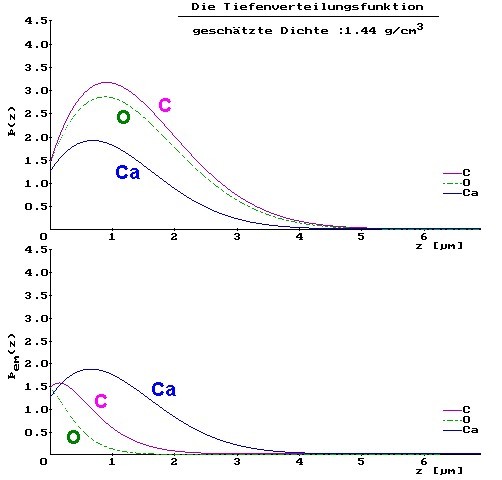
The explanation is given after a view of the depth-distribution of the generated X-rays (upper curves) and the emitted X-rays under consideration of the self absorption (lower curves) for CaCO3:
Oxygen has a much larger energy than carbon. Nevertheless the absorption of oxygen and thus the difference between the depth distribution of the produced X-rays and measured after consideration of the absorption in the sample are larger for oxygen. The cause is the presence of Ca, which has the absorption edge between the energy of carbon and oxygen. Carbon radiation cannot excite the Ca-L shell due to its smaller energy yet, completely contrary to oxygen. Thus oxygen is weakened by the plentiful presence of Ca in the sample more strongly than carbon.
The higher-energy radiation is more strongly weakened than the low-energy X-rays. That is a case of "abnormal absorption". This is caused exclusively by the absorption edge of Ca between the two element radiations. In the MgCO3 spectrum, this additional and very strong attenuations do not occur ("normal absorption"). Therefore here the O-radiation is 2..3 times more strong. If an analyst remembers the peak-height relationship between C and O for CO3 and if he would do the "quantitative" evaluation of the spectra without any software, which considers these complex nonlinear connections, he will get wrong concentrations. Then the CO3 of the CaCO3 appears obviously at first sight as CO. That result would be indeed a fatal mistake in the quantitative evaluation.