 MA-Table (Short Manual)
Software
MA-Table Download
MA-Table Manual
| Service
Analysis labs
Online-Shop

Short Manual for MA-Table
MA-Table is a Windows® programm for atomic data, which are important for Energy Dispersive X-ray Spectrometer (EDX), like
* energetic position of lines (line energies),
* relative height relations in a line series,
* critical excitation energies
* line overlaps etc.
All functions have access to a central data base.
 ... Switch between table and Icon-Bar
 ... Display periodic table of elements
 ... Element search with line energy position
 ... Change data base
 ... Print, store and copy of data
 ... Setup, registration and Demo
 ... direct call of spectra simulation (version 1.10 and higher)
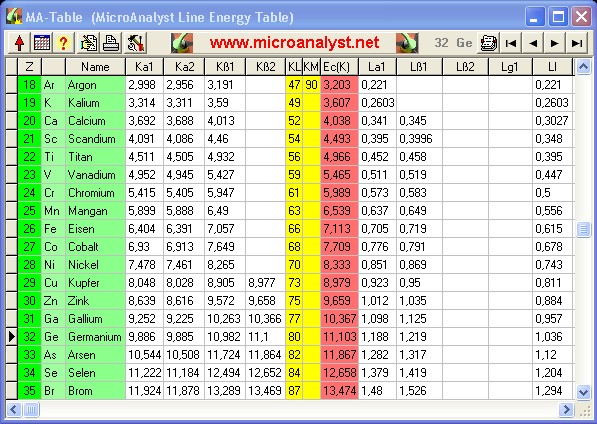
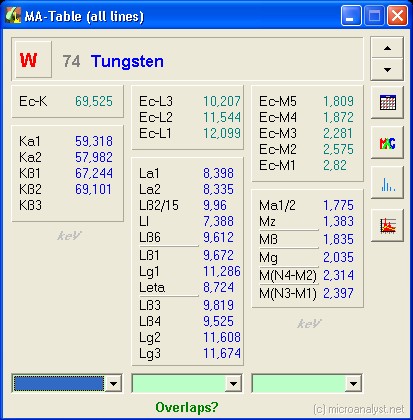
 ... Display all EDX line energies of element of choice
 ... Move the focussed line of table
 ... The most rapid way to the MA-homepage
With the first icon, the possibility exists to switch between complete table and small icon bar very fast. If MA-Table is reduced to an icon bar, the program needs very little space from the desktop and is however at any time available. But even as icon bar, one has access to all functions without any disadvantage.
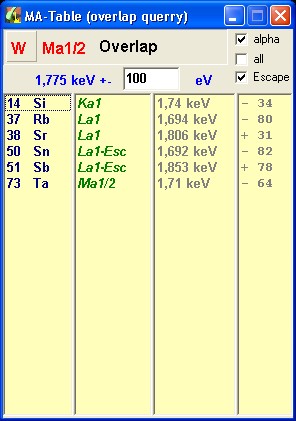
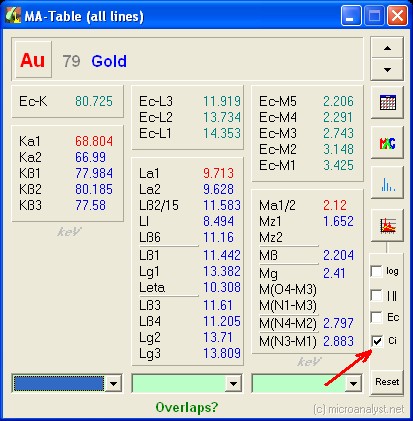
In the yellow columns the atomic numbers of elements are specified (for fast orientation), which have overlaps with the element in the line. With red color, the main critical excitation energy of the main electron potential (electron-shell) is marked:
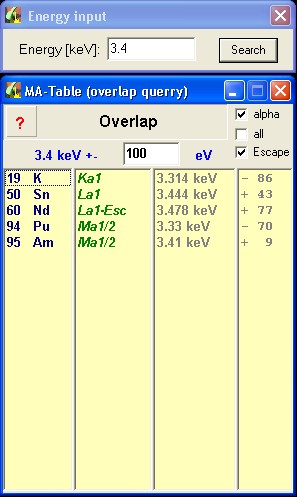
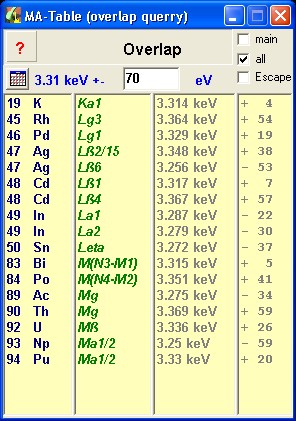
There is the possibility of looking with given line energy position for the elements, which emit lines at this position (assistance to find and identify the elements accurate):
Searching for alpha- and escape- lines is standard setting. It is possible to look for all lines or omit the escape lines (e.g. if the spectrum is yet escape-corrected).
By changing the search window (standard +-100 eV), the matched elements changes immediately. This search can be a valuable addition to the existing EDX, if one searches for unsettled peaks in the spectrum. Often the atomic data used in commercial EDX spectrometers are not sufficient or even wrong.
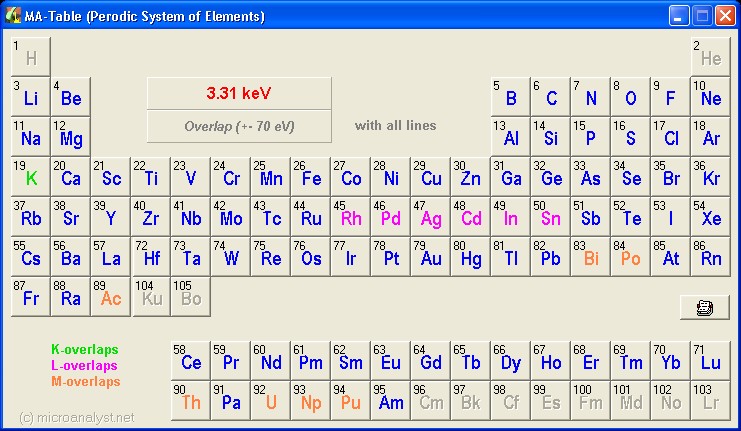
By mouse-click at PSE icon one receives immediately the overview of the possible elements in the periodic system. The individual types of X-ray lines (K, L and M) are coloured differentiated. It is a giant assistance for the qualitative analysis (evaluation) of the EDX spectra. With one view you have the overview for the identification of the elements at the entered peak position (energy of the line):
If an element from the table or via periodic system is selected, the complete line energy
series in a special window is indicated:
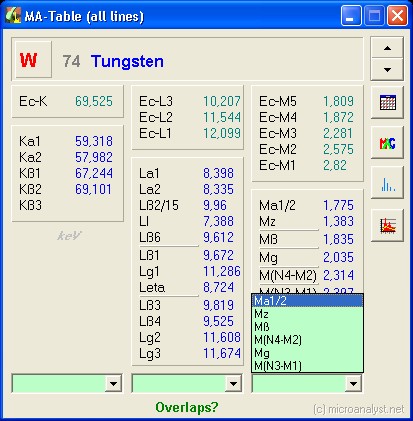
One mouse-click at a selected line, and the program begins to search for all lines of other elements, which have overlaps with the selected line. For this, hit the drop down menus with a single mouse-click. Then simple select the wished line from the menu:
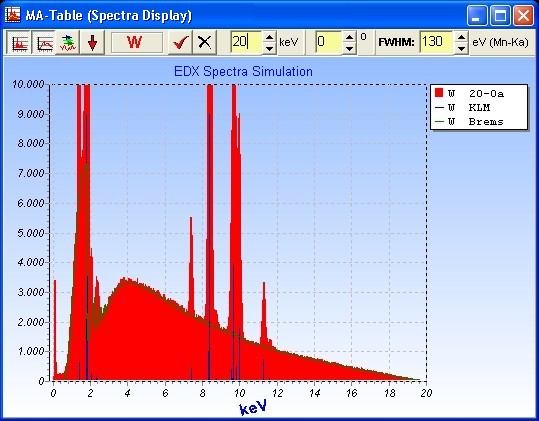
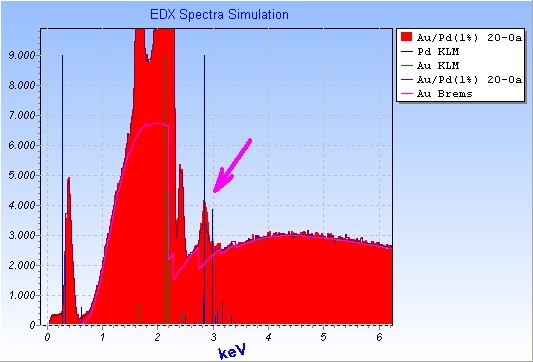
X-ray line positions and heights can be indicated or be simulated as line marks and also as calculated peak series in a spectrum window. Dependent from the excitation conditions, the spectral distribution of the Bremssrahlung is computed. Finally a complete simulation (theoretical computation) of the measured spectrum including pulse statistics and artefacts (e.g. Escape-effect) is possible in dependence of excitation conditions and detector parameters:
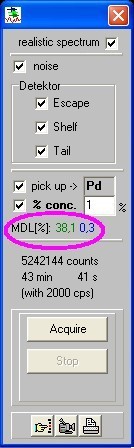
Additionally, overlays of two elements and detection limits can be simulated with given excitation conditions. In example is simulated the presence by 1% Pd in Au. Pd is strongly overlaid with the Au M(N3-M1) line at 2.883 keV (represented to comparison also with a spectrum calculated without 1% Pd):
The detection limit of Pd-L radiation is in this situation (Eo=20 keV) for instance about 0.3%. The detection limit for Pd-M radiation is given with not relevant 38%. One reason for this is the extremely strong overlap with the Au-M Escape peak (this situation can never improve an escape correction of the spectrum):
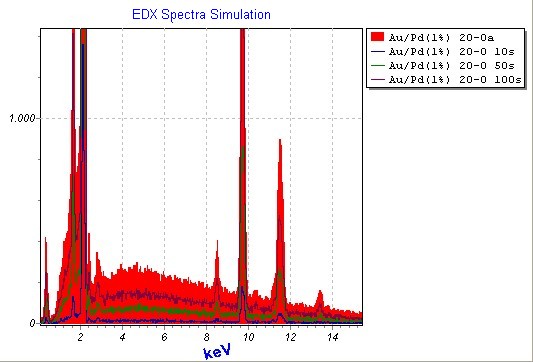
For demonstration purposes it is possible to simulate a real EDX-data acquisition process nearly realistic. This data acquisition depends from count rate of the X-ray spectrometer (setup value) and 3 predefined steps of acquisition time. In the example, the spectrum was frozen after 10, 50, 100 s and compared to the 3-minutes-spectrum (at 2000 cps).
One can watch the development of minimal detection limits with progress of current acquisition time:
All operations are very intuitive and without any menus. Setups and window positions remain even for later program runs.
Further functions are shown with built-in DEMO,
which is running without any registration need...
Version 1.10 and higher:
 A new icon of the icon bar directs the operator to spectra simulation (with realistic spectra settings):
The spectra display setup has some new features:
- display of simulated main element and the overlayed one
- scrolling through all elements even with spectra full size display
- an icon for excitation/analysis-depth calculation
- Calculation of detection limits with choice 'predefined beam curent' or
or 'predefined countrate'
Overvoltage and analysis depth calculation
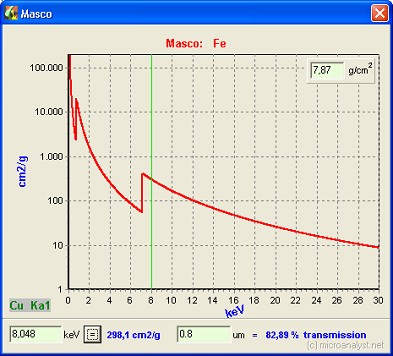
The MAC icon in element selection form is usable now:

It is possible to select the energy of interest for absorption calculation directly or via selections in the line energy form before (the same procedure as for element search with line selection). If a thickness is set, the program calculates the transmission of the X-rays (selected energy or line) in a layer consisting of the current selected element. It is possible to change the density, if necessary.
Version 1.20 and higher:
- Moseley-plot of all line energies
- PopUp menus
- new display options and functions of spectra simulation:
lines on background (with/without broadening due to spectrometer)
logarithmic display of spectra
display of marks at critical absorption energies
Reset spectra display (after mouse based zoom)
- revised atomic data base
... more details with downloadable manual: MA_Table.pdf
Version 1.22 and higher:
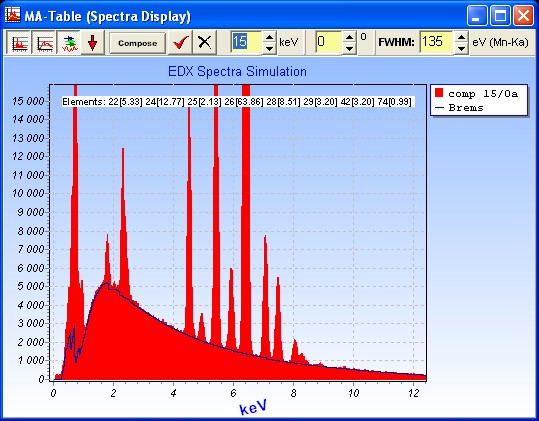
- Spectra composer to simulate spectra of specimen for any element fractions
(maximum 10 elements)
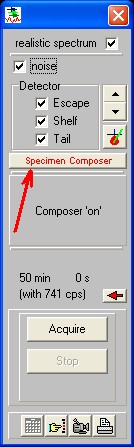
It is possible to investigate the influence of excitation, specimen tilt, acquisition time, count rate, resolution and other conditions in their influence to line heights and detection limits for any specimen in Scanning Electron Microscope. The operator has only to input the estimated specimen elements with weight fractions... and the expected spectrum will be calculated. This function is valuable particularly in complex line overlap situations to optimize e.g. the specimen excitation. It is easy to estimate the expected detection limits. The influence of different pulse processor shaping times to separation of different element lines is easy to study with a change of resolution value for simulation:
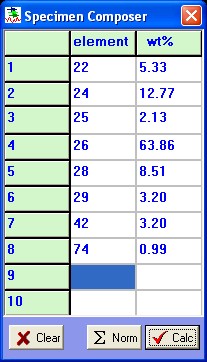
This is the easy way to call the 'Element Composer':
Version 1.40 and higher:
The spectra composer was extended for a specimen with up to 30 elements. For a maximum comfort the used elements and concentrations are always saved for later program runs. Now there is also a computation of detection limits and analysis depths for the Composer, like this was with the one- and two-element simulation in previous versions:
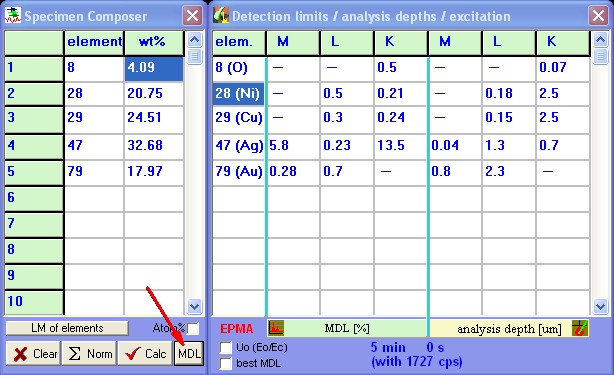
- With this tool, minimum detection limits for all elements of specimen are easy to estimate in regard to analytical conditions.
- The maximum emission depth of measured X-rays are displayed and sorted with all specimen elements. Please take in mind, this is also an estimation but all values are very helpful in comparison between the elements, used line series or between different analytical conditions. For analysis depth also absorption of low energy X-rays is considered. Low energy X-rays are possible to excite in depth, but is very often not able to leave the specimen. Therefore the absorption limits the analysis depth in many cases.
- The values are displayed always separated for K-, L- and M-radiation (if excitation is possible). Therefore it is possible to select optimum line series in regard of analytical tasks for each element. The selection of optimal line series is possible before time-consuming data acquisition with variation of possible analytical conditions in spectra simulation. Often it is very obvious, the X-rays of different elements in a spectrum are from very different specimen depths.
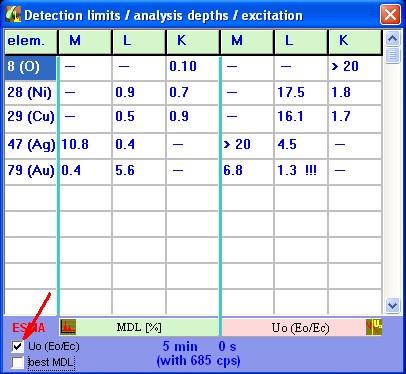
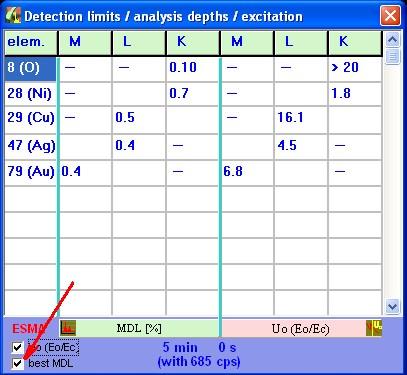
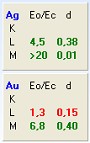
- With selecting a check-box (Uo), the overvoltages for all elements are displayed (incidence electron energy Eo /critical electron energy Ec for different electron shells).
- An other check-box (best MDL) makes permanent dynamical selection of the line series with best detection limits for each element. With this a procedural instruction is given, which line series of specimen in regard of conditions are the best choices. Please take in mind the always different analysis depths in connection with expected homogenousity of specimen.
Version 1.60 and higher:
 (1)
(1)
 (2)
(2)
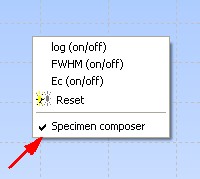
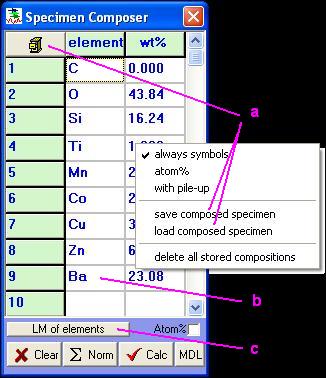
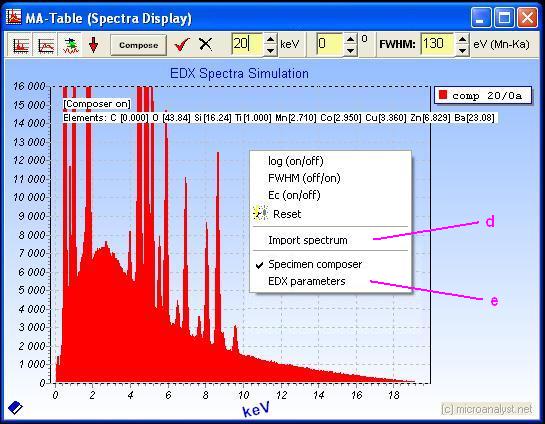
There are new features of the spectra popup menu presentation and also a new pop-up menu of the Composer window:
a) Created compositions of samples can be saved for later use. A name for this composition is to select to use for a later re-load. If there are samples stored, then an additional button appears with the symbol of file store cabinet. This panel is functionally identical to the usual function for specimen load.
b) Element symbols, and atomic numbers can be entered, even as mixed. If 'always symbols' has been chosen, are all entered atomic numbers automatically converted into element symbols. The spelling is not important in regard of capital or no capital letters.
c) Line-marks are displayed from the list of the selected element (mouse-click) instead of the spectrum. A copy of the calculated spectrum for the spectra comparison before is smart to use these line-marks for better verification the ingredients of the spectrum.
d) There is the option to import a spectrum to compare (EMSA format or SPC). An automatic adjustment to the absolute simulated spectrum after import of acquired spectrum is performed. The adjustment energy is possible to choose freely. Additional controls to manipulate presentation of the spectra are displayed.
e) The data of the spectrometer used for the calculations (simulation) are displayed and possible to change with 'EDX parameters'. Attention, the data from acquired spectrum are not taken over!

 (3)
(3)
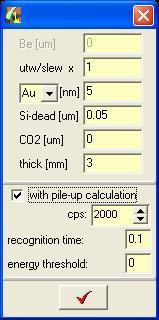
The simulation of a pileup effect depends on the behavior and temporal resolution of the energy threshold of the pileup detection of the pulse processor and may be covered experimentally to be adjusted.
FAQ's / Hints:
Often one would like to manipulate the spectrum representation to make details visible.
That is possible also in MA-Table:
Zoom:
In order to select a cutout, the left upper corner of the cutout is to be selected with mouse. Hit the left mouse button. Now move the mouse to to the right lower corner of the desired cutout (do not release left mouse button!), then the rectangle of the coming spectrum cutout is stretched. Now the mouse button is to be only released, and the spectrum representation is going to change automatically to the desired cutout.
Zoom canceling:
Proceed as above with the zoom shot, only from right down to the left up. The selected cut is here no matter, since the spectrum representation returns in each case again to the start situation.
Scroll of the spectrum representation:
Press the right mouse button within the spectrum representation and move the mouse with pressed right mouse button back and forth.
You want to work in other programs directly with the Windows®-clipboard
(to copy, to paste). Or you want to use functionalities, which use the clipboard
indirectly and the MA-Table is opened...
... and some of these functions do not work:
That is correct. In the free version of MA- Table there are restrictions. A restriction is that the represented data and computed spectra cannot be copied. In order to use the clipboard in other programs, the complete MA-Table program does not have to be terminated. It is sufficient, if the opened MA-Table windows are closed and the program is transferred into the initial state (start situation: Table or Icon bar).
MA-Table produces automatic insertions (OnTop) in the free version only. If you are
working with other programs (MA Table is not in the foreground), then these
advertisement windows can disturbing you frequently:
One does not need to terminate the MA-Table program, in order to avoid the insertions. It is sufficient to reduce the program for Icon bar and to close all opened MA-Table windows, if you do not work actively straight with it. Thus the MA-Table features are permanent 'standby' and the advertisement insertions constantly disturb nevertheless not when operating other software.
New version of MA-Table manual (2.xx)!
New!
A new version 2.10 is ready for download with some extentions:
>>>