 Common Information to Microanalysis
EPMA Info1
Info2
Info3
Info4
Info5
Info6
Info7
Info8
Micro-XRF
Info1

Some Information about Element Distributions
Mapping, Element-Imaging and ColorSEM:
The conventional Element-Mapping
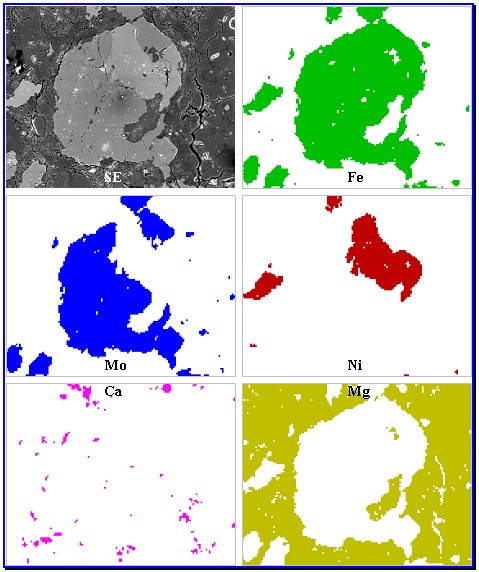
If one regards a conventional element map (e.g. the illustration), then the difference between the element images and the Electron Microscope images becomes clear. While the pictures of the electron microscope have a so-called data depth (differently gradations of the brightness -> gray tones), the element distributions give usually only digital information according to the principle: The element is available or not.
The reason is about several order of magnitude smaller signal strength of the X-ray detectors in comparison to the electron detector. No picture with larger signal depth could be produced in a reasonable time. The maps usually in different colors represented, for each element their own color. Usually a mixing picture is produced. The evaluation is only possible in direct comparison with the electron image:
Introduction to the technology of the element images
New X-ray detectors (e.g. a SDD) and more modern pulse processors permit a signal strength larger around factor 10 than the conventionally operated Si(Li) and are a substantial 'brighter' source of light . With these systems also element pictures are possible with a comparable signal depth to the Electron Microscope image with acceptable recording time. With conventional systems with count ratios of 50 kcps and less, the images must be measured only longer. It is important that the image pick-up equipment for element pictures permit a gray tone or a color graduation of at least 256 steps (1 byte). Binary maps or Mappings with utilisation of a pixel density for the representation of the gradations are not suitable for the state of the art Element-Imaging.
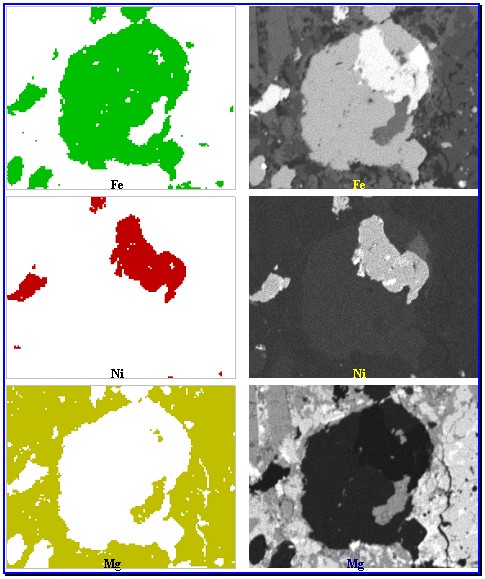
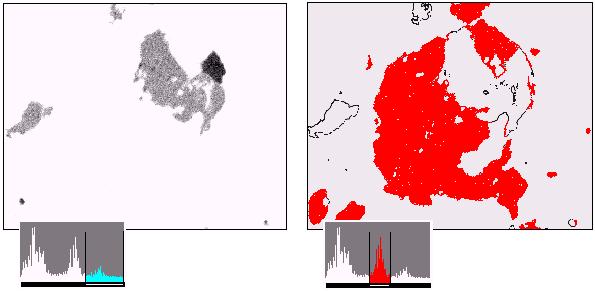
The benefits of Element Images becomes very clear in comparison of both techniques on the basis a meteorite cross section:
Cross-cut of meteorite rock, element distributions (on the left of conventional maps, on the right
the Element Imaging pictures of the same elements with gray tones)
In the element images (right) different phases of the Fe, Ni and Mg concentrations are clearly visible.
In the case of the Mapping (left) a substantially smaller force of evaluation results.
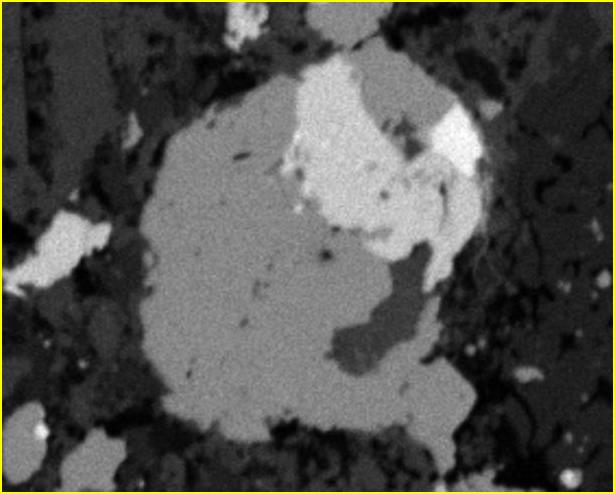
The Fe-image has nearly the data depth of a picture in normal quality (with 236 gray tones). The lateral resolution is worse in comparison to an Electron Image:
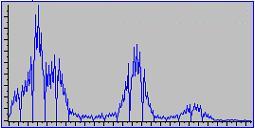
Fe-image and brightness histogram.
The different phases of the Fe in the meteorite cut are clearly recognizable both in the picture and in the brightness histogram.
The statements of the element pictures are substantially clearer in direct comparison between the two techniques. Data depth, resolution and thus the evaluableness of the element images are clearly superior to the classical element map.
Gray tone range selectively spread and inverted.
Emphasis of the middle Fe-phase as binary picture.
2 phases iron clearly distinguishable.
About 30% surface portion correspond to this Fe-phase.
Phase images can be produced by combination of single element images.
Due to the sufficient signal strength (pulse density), possible with modern detectors and amplifiers, element pictures can be taken, which are comparable with the usual Electron Images in brightness, contrast and resolution. The acquisition of the element-pictures requires only as much time and knowledge as the acquisition of a good electron image!
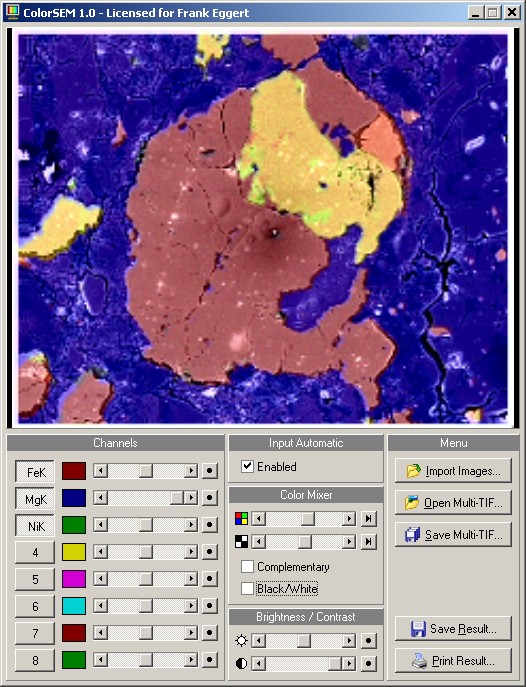
The electron images become colored: ColorSEM
If each gray tone element picture is assigned to a color and then merged with the black-and-white electron image with much better surface resolution (mixed in true-color space), a colored Electron Microscope mage is born. You are able to do this job very easy with the ColorSEM program, specialized for the Electron Microscopy .
ColorSEM - Software
Note! The Ca-picture was not merged in contrast to the upper map.
You have only to store BMP- or TIFF-images with your equipment to be able to work with ColorSEM. An electron image is expected (SE-image, BE-image, ...) and maximally 8 suitable element images (same magnification and identical part of specimen surface). The SE-image can be larger from view of the pixel numbers, but the axial ratios must be identically.
It is absolutely important that the element images (Mappings) contain gray tones. Thereby it is not important whether the element images which can be imported have already a color. The color is assigned independently in ColorSEM program.
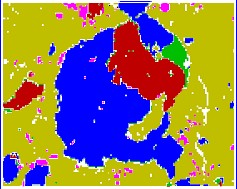
The comparison between SE-image, conventional Map and the ColorSEM image is out of question:
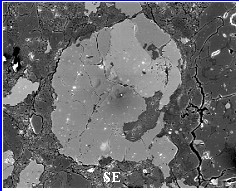
 SE-image
conventional Map
ColorSEM Image (Element-Imaging)
SE-image
conventional Map
ColorSEM Image (Element-Imaging)
Nuances of the different Fe/Ni phases meteorites highlighted with different colours. The structure of the surface is clearly visible by the basis electron image. Also the element distribution image seems to be substantially better by the association to the more highly resolved grey picture (electron image). That is however a fallacy, weakness of the functionality of human eyes which would behave leaves. The conventional colour television makes itself the same effect too uses. The transferred color pictures are substantially more weakly dissolved than the b/w TV picture. In the mixture one does not notice it.
The Electron Microscope pictures becomes colored:
Which of the two images you would rather give to your client/customer to the illustration of the sample,
the pure conventional B/W electron image or the colored ColorSEM picture?
Since the x-ray offers a local resolution in the order of magnitude of only 1 micron (because of the excitation and interaction processes in the sample), only magnifications of maximally 1000 make sense for element images. The resolution of the electron images is in the order of magnitude of nanometers. Thereby it is meaningful to take the electron images with a larger dimension of picture (pixel number, pixel density). Mixing with smaller element pictures leads to that effect of the subjective perception of a better resolution even the element distributions, like discussed above. That is because the eyes process and interprete the more finely resolved structures of the electron image in each case together with the color content (human online image processing).
Further examples:
Surface of breaks:
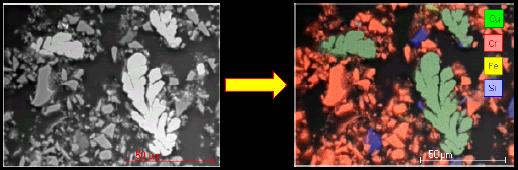 In contrast to the electron image the ColorSEM picture supplies
additionally also analytic information about the element distribution.
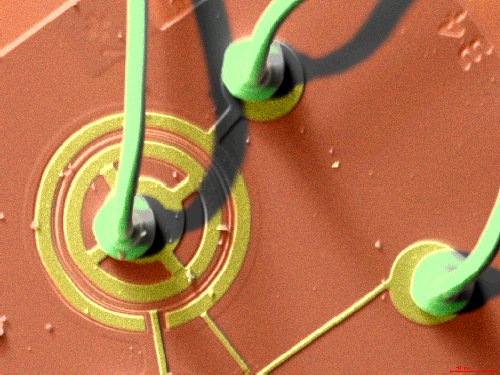
Transistor:
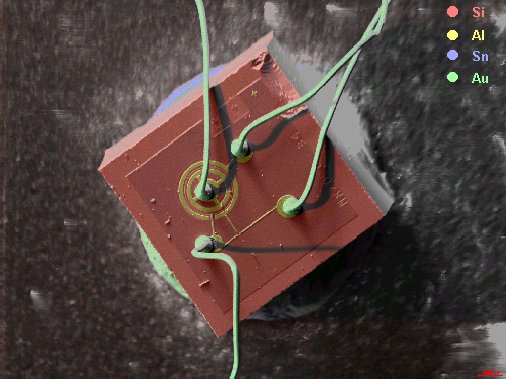
 The illustration of a semiconductor structure colored in two different magnifications. Similarly to normal human vision, the color supplies with information about the 'quality' of specimen (additionally to the structure of the object). The force of expression of the colored Electron Microscope image (ColorSEM) is substantially larger than with a conventional image. The color shade strengthens the three-dimensional effect and results from the position of the X-ray spectrometer (colorless ranges are covered of the wires).
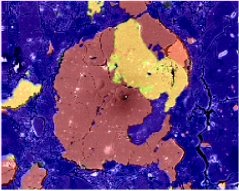
Cross section (high-dissolved picture):
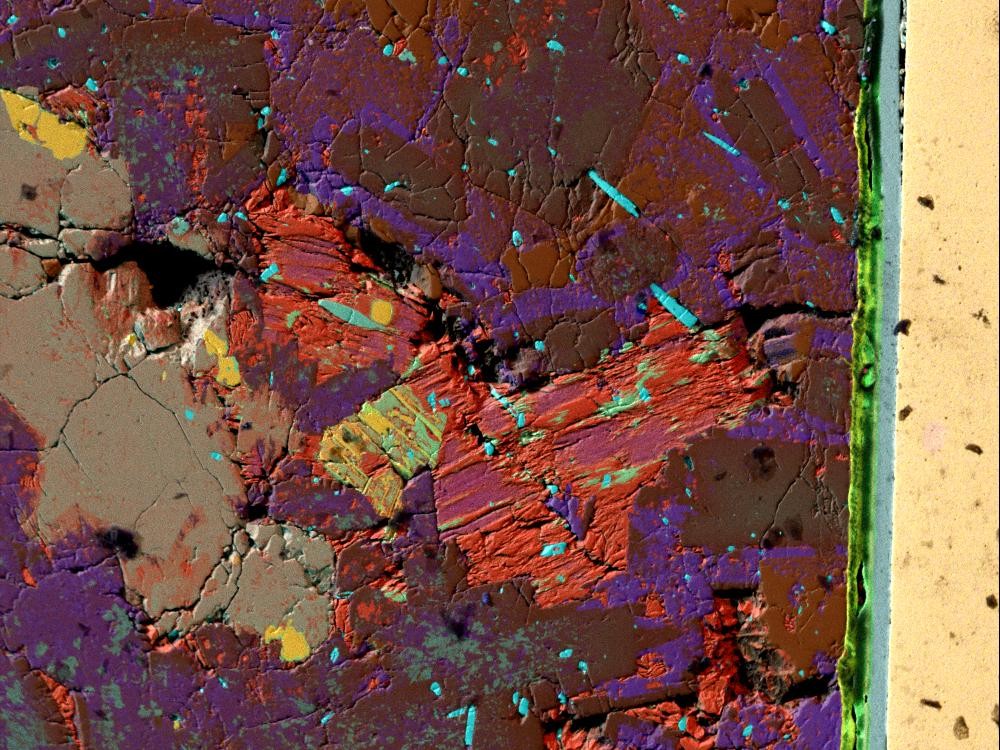
An example for a high-resolved ColorSEM picture and a demonstration that with chemically complex samples also mixed colors turn out.
Clearly very many different mineral phases can be differentiated with only one view. The mixed colors result according to the rules of colors. The appearance of the picture depends thereby also of the allocation of the colors to the individual elements (... and also something from the fate of the operator). The colors are however no pure coloration but have analytically relevant background. The question, which phase it concerns with a color, is answered with a quantitative point analysis here. With identical setings and color allocation the operator can reach very fast experience, working with a large sample number of same quality. One becomes more to see by the additional color information at Scanning Electron Microscope (SEM), using ColorSEM technology.
PDF-documents with these topics:
"Quantitative Element Images"
"Element Imaging with MultiMax"
... are located in
download area
... further Information (historic): ColorSEM Info
... Demo and operator information ColorSEM: ColorSEM Demo
... Download of Software: ColorSEM Software